Hyperbyte Service - Tooling & Architecture Overview


Our Toolkit: Built on the Shoulders of Open-Source Giants
Hyperbyte’s platform isn’t a monolith. It’s a curated blend of open-source tools, custom AI, and battle-tested workflows — deployed into your environment, fully visible, zero vendor lock.
Visual Placeholder:
(⚠️ Insert diagram from Austin: Stack diagram showing data flow from infra → Telegraf → InfluxDB → Hyperbyte AI → Grafana)
Core Stack:
- Telegraf – Data collector (300+ plugins, lightweight, flexible)
- InfluxDB – Time-series data backend (optional, secure)
- Grafana – Visual layer (clean dashboards + branded UI)
- Hyperbyte AI Assistant – Real-time anomaly detection and alerting
- Alerting Channels – Slack, Teams, PagerDuty, Email, etc.
Optional Extras:
- Custom Metrics Ingest – We can scrape any Prometheus endpoint
- Advanced AI Modules – Predictive capacity planning, SLO tracking
- Access Gateway – Pull your own metrics via API
Why This Architecture Wins:
- Open Source = Transparent + Flexible
- AI Layer = Smarter, Not Louder
- Human Support = Trusted Execution
Suggested Visuals:
- Interactive toolchain diagram (or animated GIF for homepage)
- Brand logos for each tool (Telegraf, Grafana, etc.)
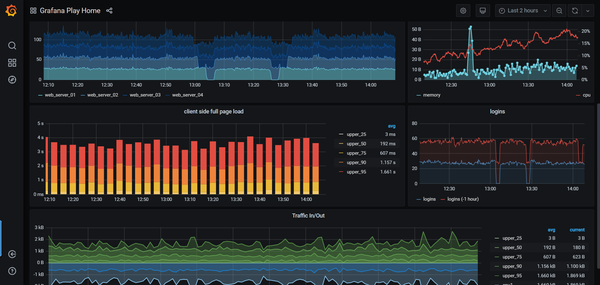
- Captioned screenshot of a live Grafana dashboard showing all the above in context